
Even nearly two decades after the 2008 housing crash, headlines mentioning rising foreclosures can trigger immediate concern. If you are planning to buy or sell a home, you may wonder whether distressed properties are about to flood the market.
While some buyers hope for a wave of steep discounts and some sellers worry about sudden competition, current housing data points to neither. Examining foreclosure volume alongside housing inventory and homeowner equity shows why the market remains on solid footing.
Understanding the numbers behind recent headlines helps you make confident decisions without reacting to misleading clickbait.
Table of Contents
- Why Foreclosure Increases Remain Well Below Crash Levels
- How Balanced Housing Supply Absorbs Distressed Listings
- Local Chicago Broker Insight on Foreclosures and Inventory
- Why Record Homeowner Equity Prevents a Foreclosure Wave
Why Foreclosure Increases Remain Well Below Crash Levels
According to ATTOM’s Mid-Year 2026 U.S. Foreclosure Market Report, completed foreclosures rose 33% compared to the prior year. Taken alone, a 33% jump sounds dramatic, but historical context changes the picture entirely.
Even after that annual increase, completed foreclosures remain roughly 26% lower than they were in the first half of 2020. Lenders completed approximately 28,000 foreclosures nationwide during the first half of 2026—a tiny fraction of the 2008 crash era, when completions regularly topped 200,000 in just a few months.
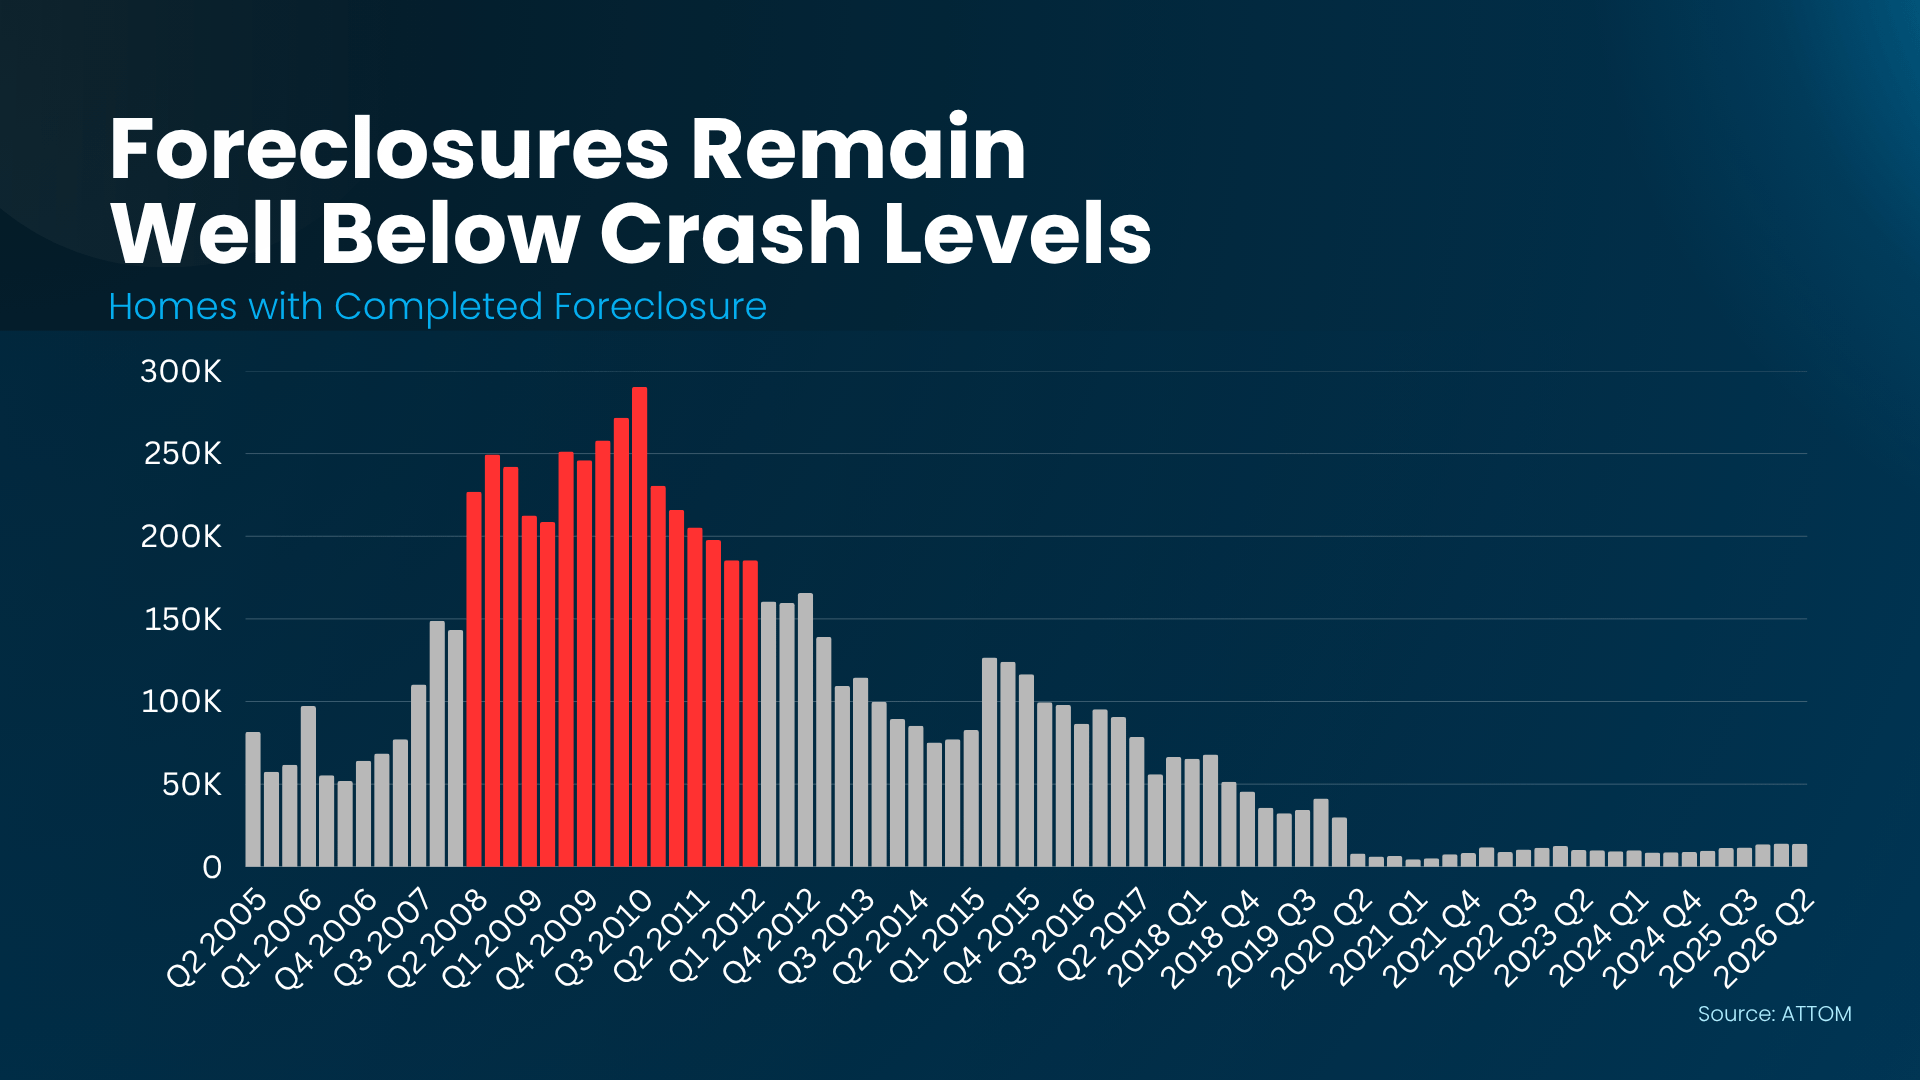
As Rob Barber, CEO at ATTOM, noted in the firm’s 2026 reporting, overall foreclosure volumes remain well below historical norms while the broader housing market continues to show resilience. Because total volume is so low, existing supply easily absorbs these properties.
How Balanced Housing Supply Absorbs Distressed Listings
During the 2008 financial crisis, forced sales and bank repossessions overwhelmed the housing market with excess inventory. Today’s active listing supply looks nothing like that period.
Real estate analysts measure inventory using “months’ supply”—the time it would take to sell every active listing at the current sales pace. A balanced market typically sits between four and six months of supply.
Data from the National Association of Realtors (NAR) places national inventory at roughly 4.8 months’ supply, less than half of where supply peaked during the last housing crash.

As Logan Mohtashami, Lead Analyst at HousingWire, pointed out, an actual surge of foreclosures would have pushed active inventory dramatically higher. Instead, balanced supply keeps home values stable across most communities.
Local Chicago Broker Insight on Foreclosures and Inventory
In Chicago, Cook County, and the surrounding suburbs, localized data tells a similar story. Even when national foreclosure headlines circulate, local housing inventory remains tight enough that well-maintained homes continue to attract qualified buyers.
“In today’s Chicago market, smart sellers are using closing concessions instead of headline price cuts to keep buyer monthly payments manageable.”
— Tammy Jackson, Managing Broker, KM Realty Group LLC
At KM Realty Group LLC, our recent South Side and South Suburb transactions showed that offering a 2-1 seller rate buydown reduced days on market from 45 days down to 12 days. If you want to see how local filings compare to national trends, reviewing our breakdown of Chicago foreclosure trends shows why distressed properties represent only a minor slice of local sales.
The biggest reason distressed inventory stays low comes down to the massive equity cushion most homeowners hold today.
Why Record Homeowner Equity Prevents a Foreclosure Wave
Home equity is the primary safeguard preventing financially stressed owners from ending up in foreclosure. Combined data from the U.S. Census Bureau and ATTOM indicates that roughly two in three homeowners either own their home free and clear or hold at least 50% equity.
According to Cotality’s Q2 2026 Homeowner Equity Insights, the average mortgaged homeowner holds approximately $310,000 in equity. When an owner with substantial equity faces a financial hardship, they can sell their home on the open market, pay off their mortgage, and walk away with cash rather than losing the property to the bank.
Back in 2010, nearly one in four mortgaged homes were “underwater,” meaning the owner owed more than the property was worth. Today, Cotality data shows only about 2% of mortgage borrowers are underwater (with ATTOM’s stricter threshold showing just 3.2% seriously underwater at a 125% or higher loan-to-value ratio). If you are unsure where your property stands, checking what your home is worth gives you a clear baseline of your available equity.
Frequently Asked Questions
Are foreclosure rates returning to 2008 levels?
No. While annual percentages have risen from pandemic-era lows, total completed foreclosures in the first half of 2026 (around 28,000 nationwide) represent a small fraction of the more than 200,000 quarterly completions seen during the 2008 financial crisis.
Can buyers still find foreclosure deals in today’s market?
Distressed properties exist in small numbers, but they rarely flood individual neighborhoods. Because most homeowners hold substantial equity, struggling owners typically sell through traditional listings rather than letting lenders repossess the home.
What does it mean to be “underwater” on a mortgage?
Being underwater—also called negative equity—means your remaining mortgage balance is higher than your home’s current fair market value. Only about 2% of U.S. borrowers fall into this category today, compared to nearly 25% in 2010.
Planning Your Next Move with Market Clarity
Sensational headlines often focus on percentage spikes without explaining the low starting point behind them. With national housing supply balanced at 4.8 months and homeowner equity near record levels, the broader real estate market remains stable.
Whether you are evaluating your current equity before listing or searching for your next property, rely on verified local market data rather than national noise. Browse active Chicago homes for sale or contact our team at KM Realty Group LLC for an accurate look at neighborhood values and inventory.